

What this page answers
After Amazon takes its fees and refunds, after your cost of goods and after advertising, what is actually left, and roughly what Amazon will pay out.
Whose data and scope
- One store and one marketplace.
- Sales and units come from orders by order date. Fees, refunds and reimbursements come from Amazon's financial events and are matched to the orders in the period, so the ladder reflects what those orders earned rather than what Amazon happened to settle on those days.
- Cost of goods uses the landed cost per SKU from Settings, SKU Costs & Timing.
- Advertising cost is Amazon Ads spend for the period.
How to read it
Financial ladder
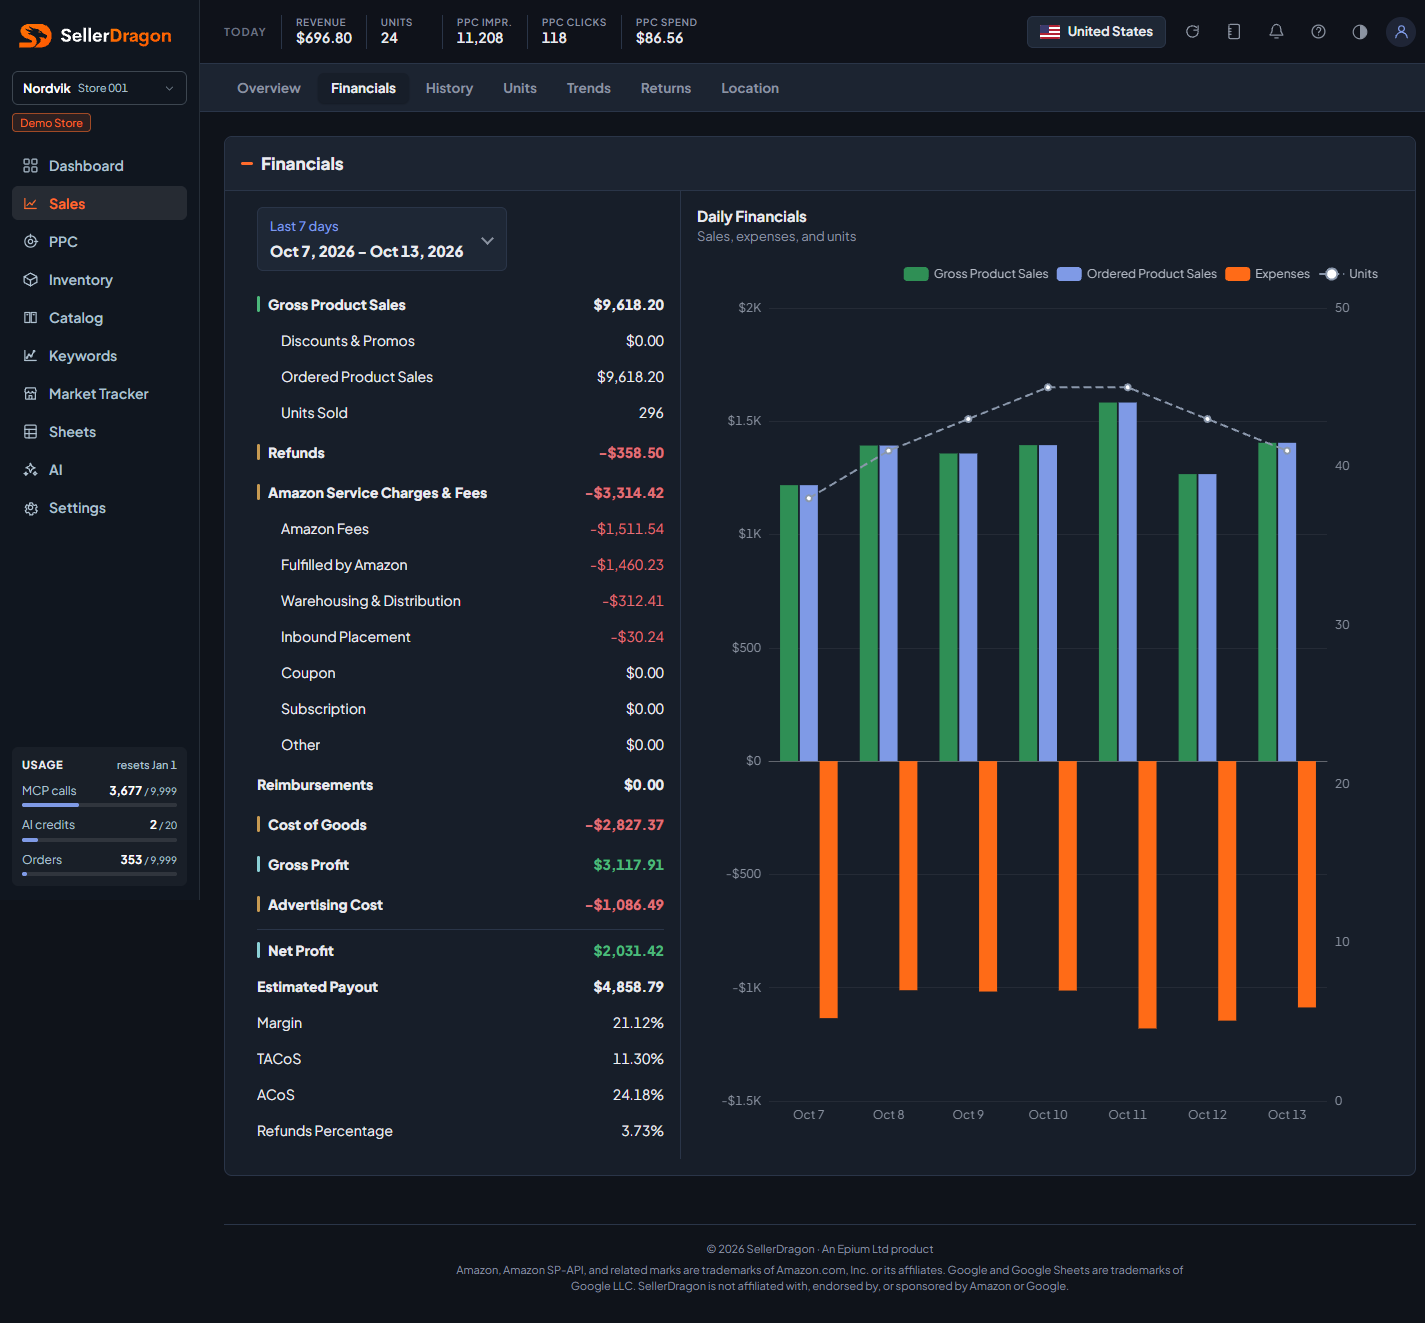
The picker at the top sets the period; the default is the last 7 days. The same presets as the Sales overview are available, plus a custom range.
Read the ladder top to bottom:
- Gross Product Sales is the sales value before promotions. Discounts & Promos are taken off to give Ordered Product Sales. Units Sold is the unit count.
- Refunds is the refunded amount for the period, shown negative.
- Amazon Service Charges & Fees is the total of every Amazon fee line, split into Amazon Fees (referral), Fulfilled by Amazon (FBA fulfilment), Warehousing & Distribution, Inbound Placement, Coupon, Subscription and Other. Other is whatever remains, so the parts always add up to the total.
- Reimbursements is money Amazon paid back for lost or damaged inventory and similar claims.
- Cost of Goods is units sold times landed cost.
- Gross Profit is ordered sales minus refunds, minus Amazon fees, plus reimbursements, minus cost of goods.
- Advertising Cost is then taken off to give Net Profit.
- Estimated Payout is what Amazon disburses to you: ordered sales minus refunds, fees and ad spend, plus reimbursements. It is net profit with your cost of goods added back, because Amazon does not pay your supplier.
The ratios below the ladder: Margin is net profit over gross sales. TACoS is ad spend over ordered sales. ACoS is ad spend over ad sales. Refunds Percentage is refunds over gross sales.
Daily financials chart
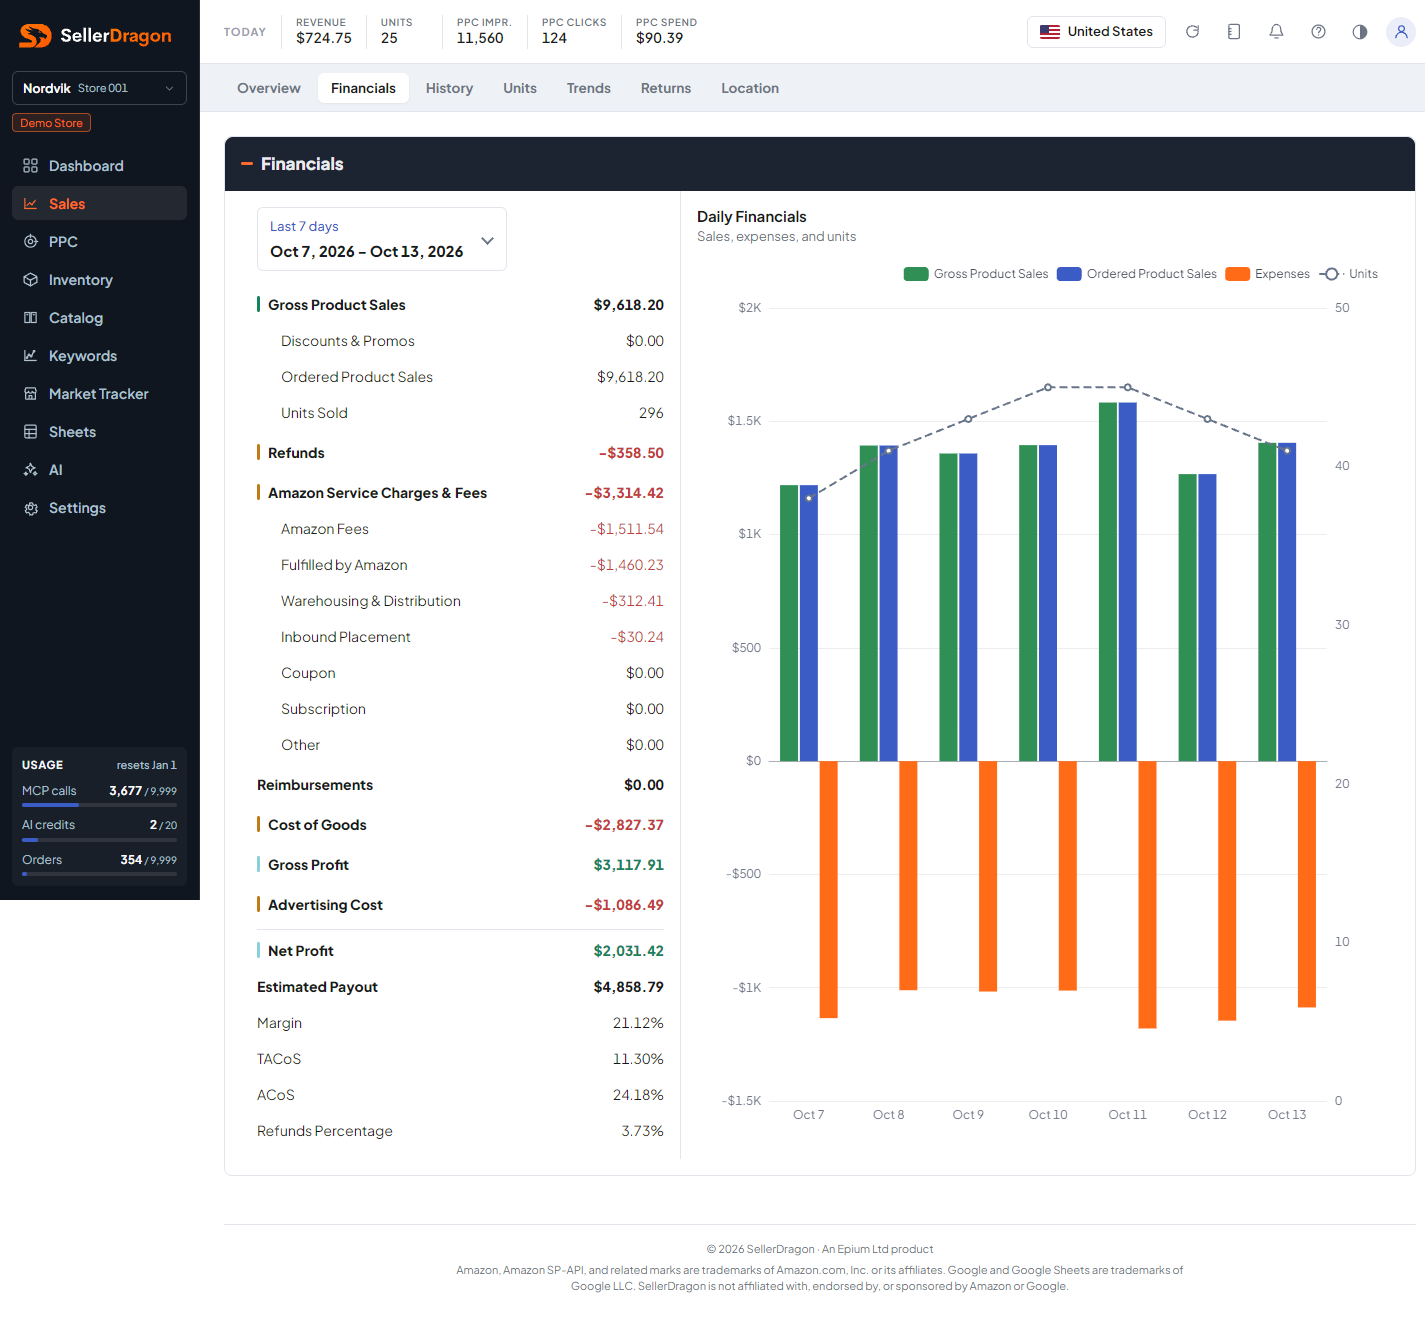
One group of bars per day in the period: gross product sales, ordered product sales and expenses (refunds, fees, cost of goods and ad spend together, drawn below the line). The dotted line is units sold on the right axis.
Where to go next
- Sales overview for the comparison view and bestsellers.
- SKU Costs & Timing to keep cost of goods accurate.
Something on this page unclear?
Ask us how