

What this page answers
Are sales, profit and refunds going up or down compared with before, and which products sell most.
Whose data and scope
- One store and one marketplace, as picked in the sidebar and header.
- Ordered product sales, orders and units come from your Amazon orders by order date in the marketplace's local time.
- Refunds come from Amazon's financial events, by the date Amazon booked the refund.
- Landed cost per SKU comes from Settings, SKU Costs & Timing. Profit numbers are only as good as those costs.
How to read it
Metric tiles and chart
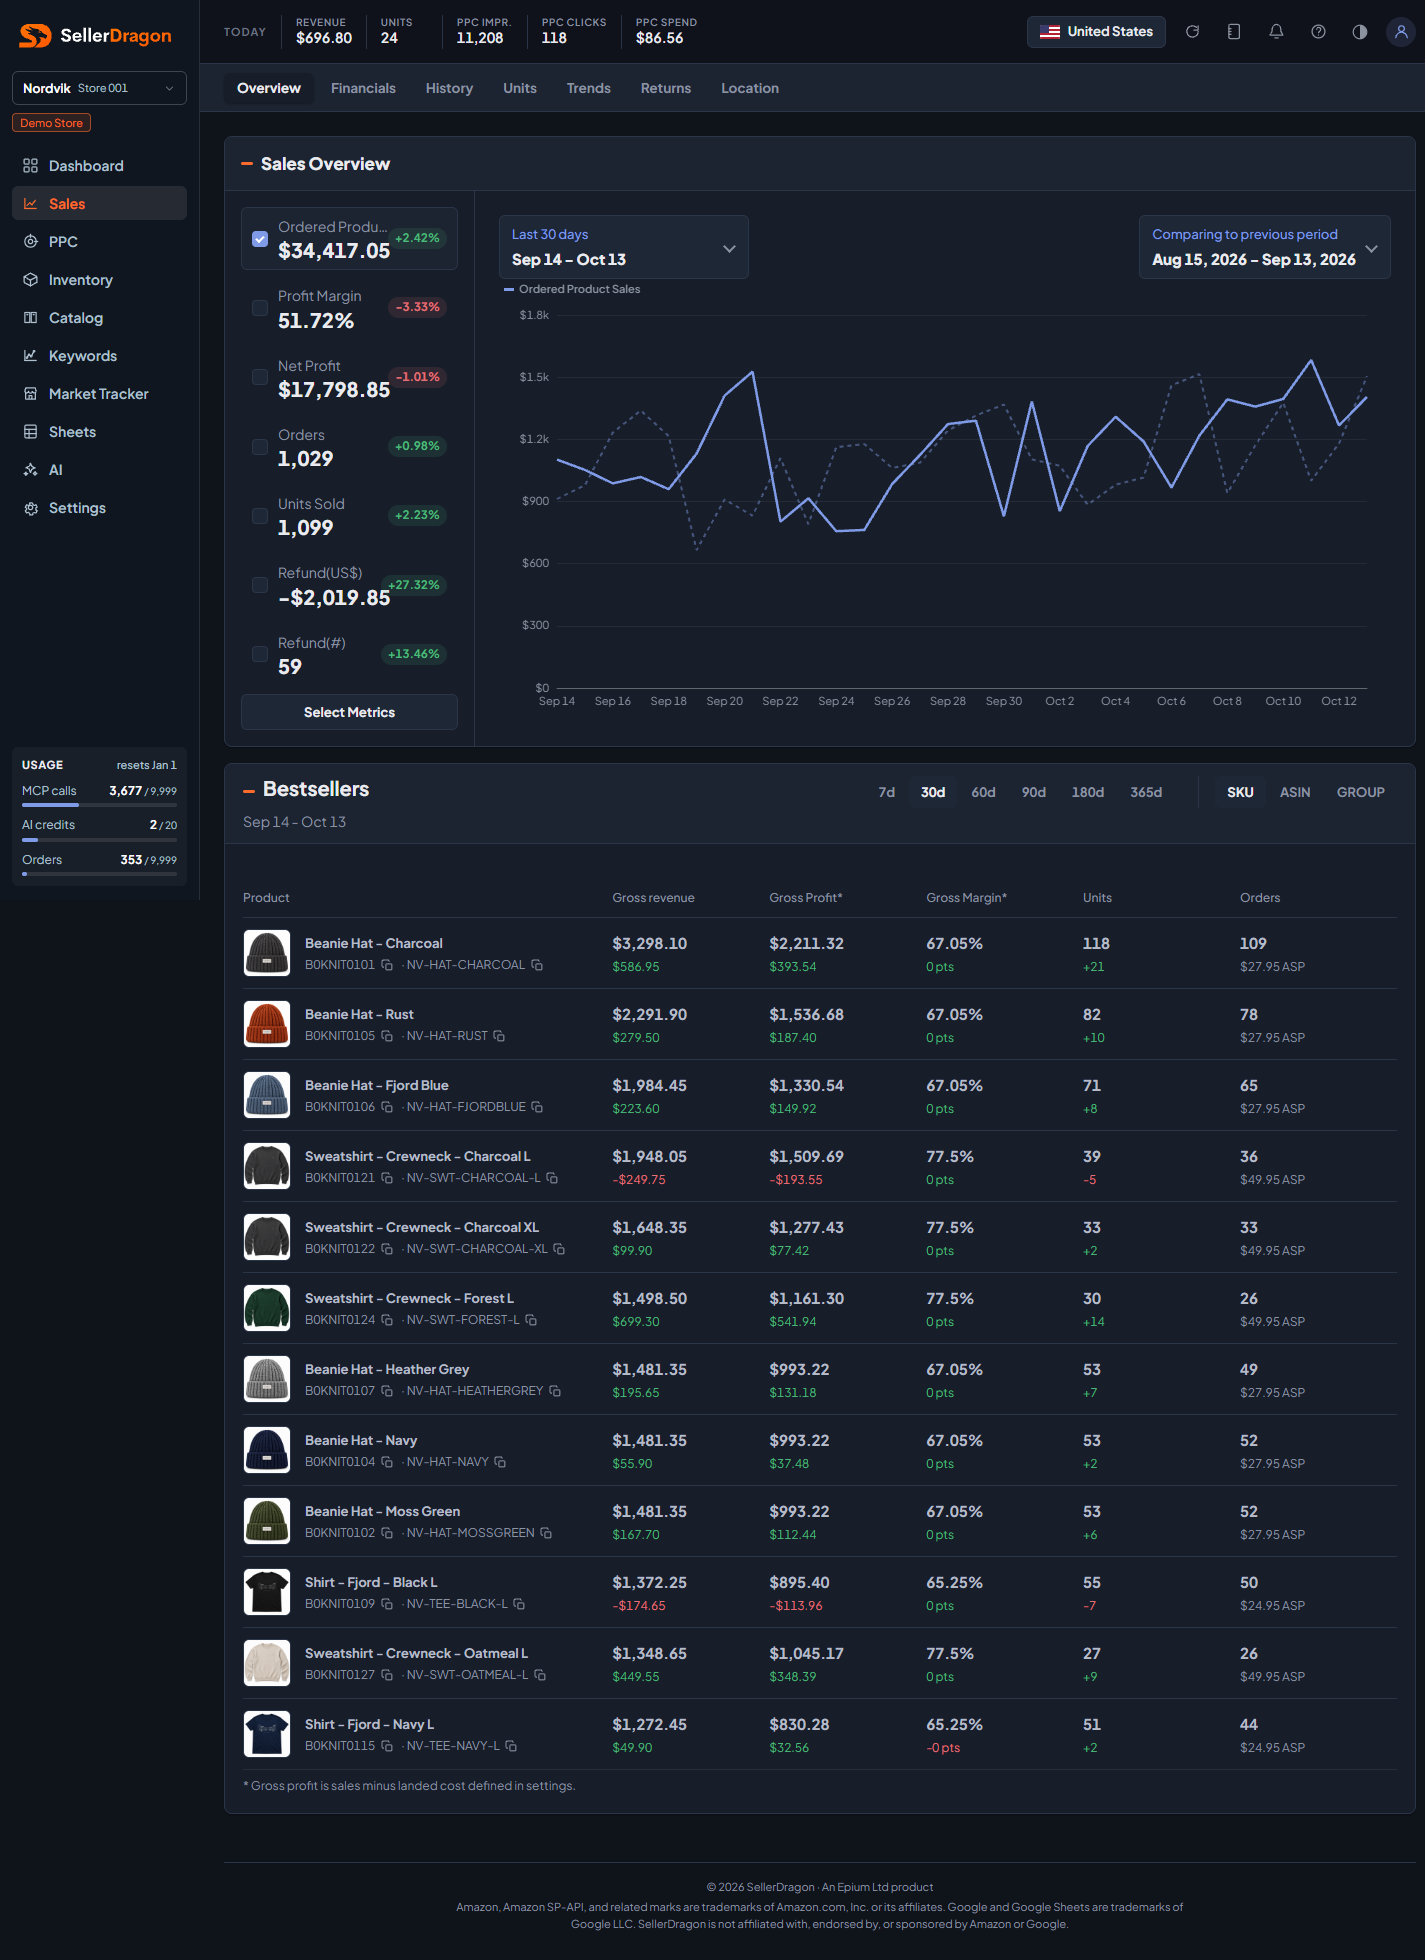
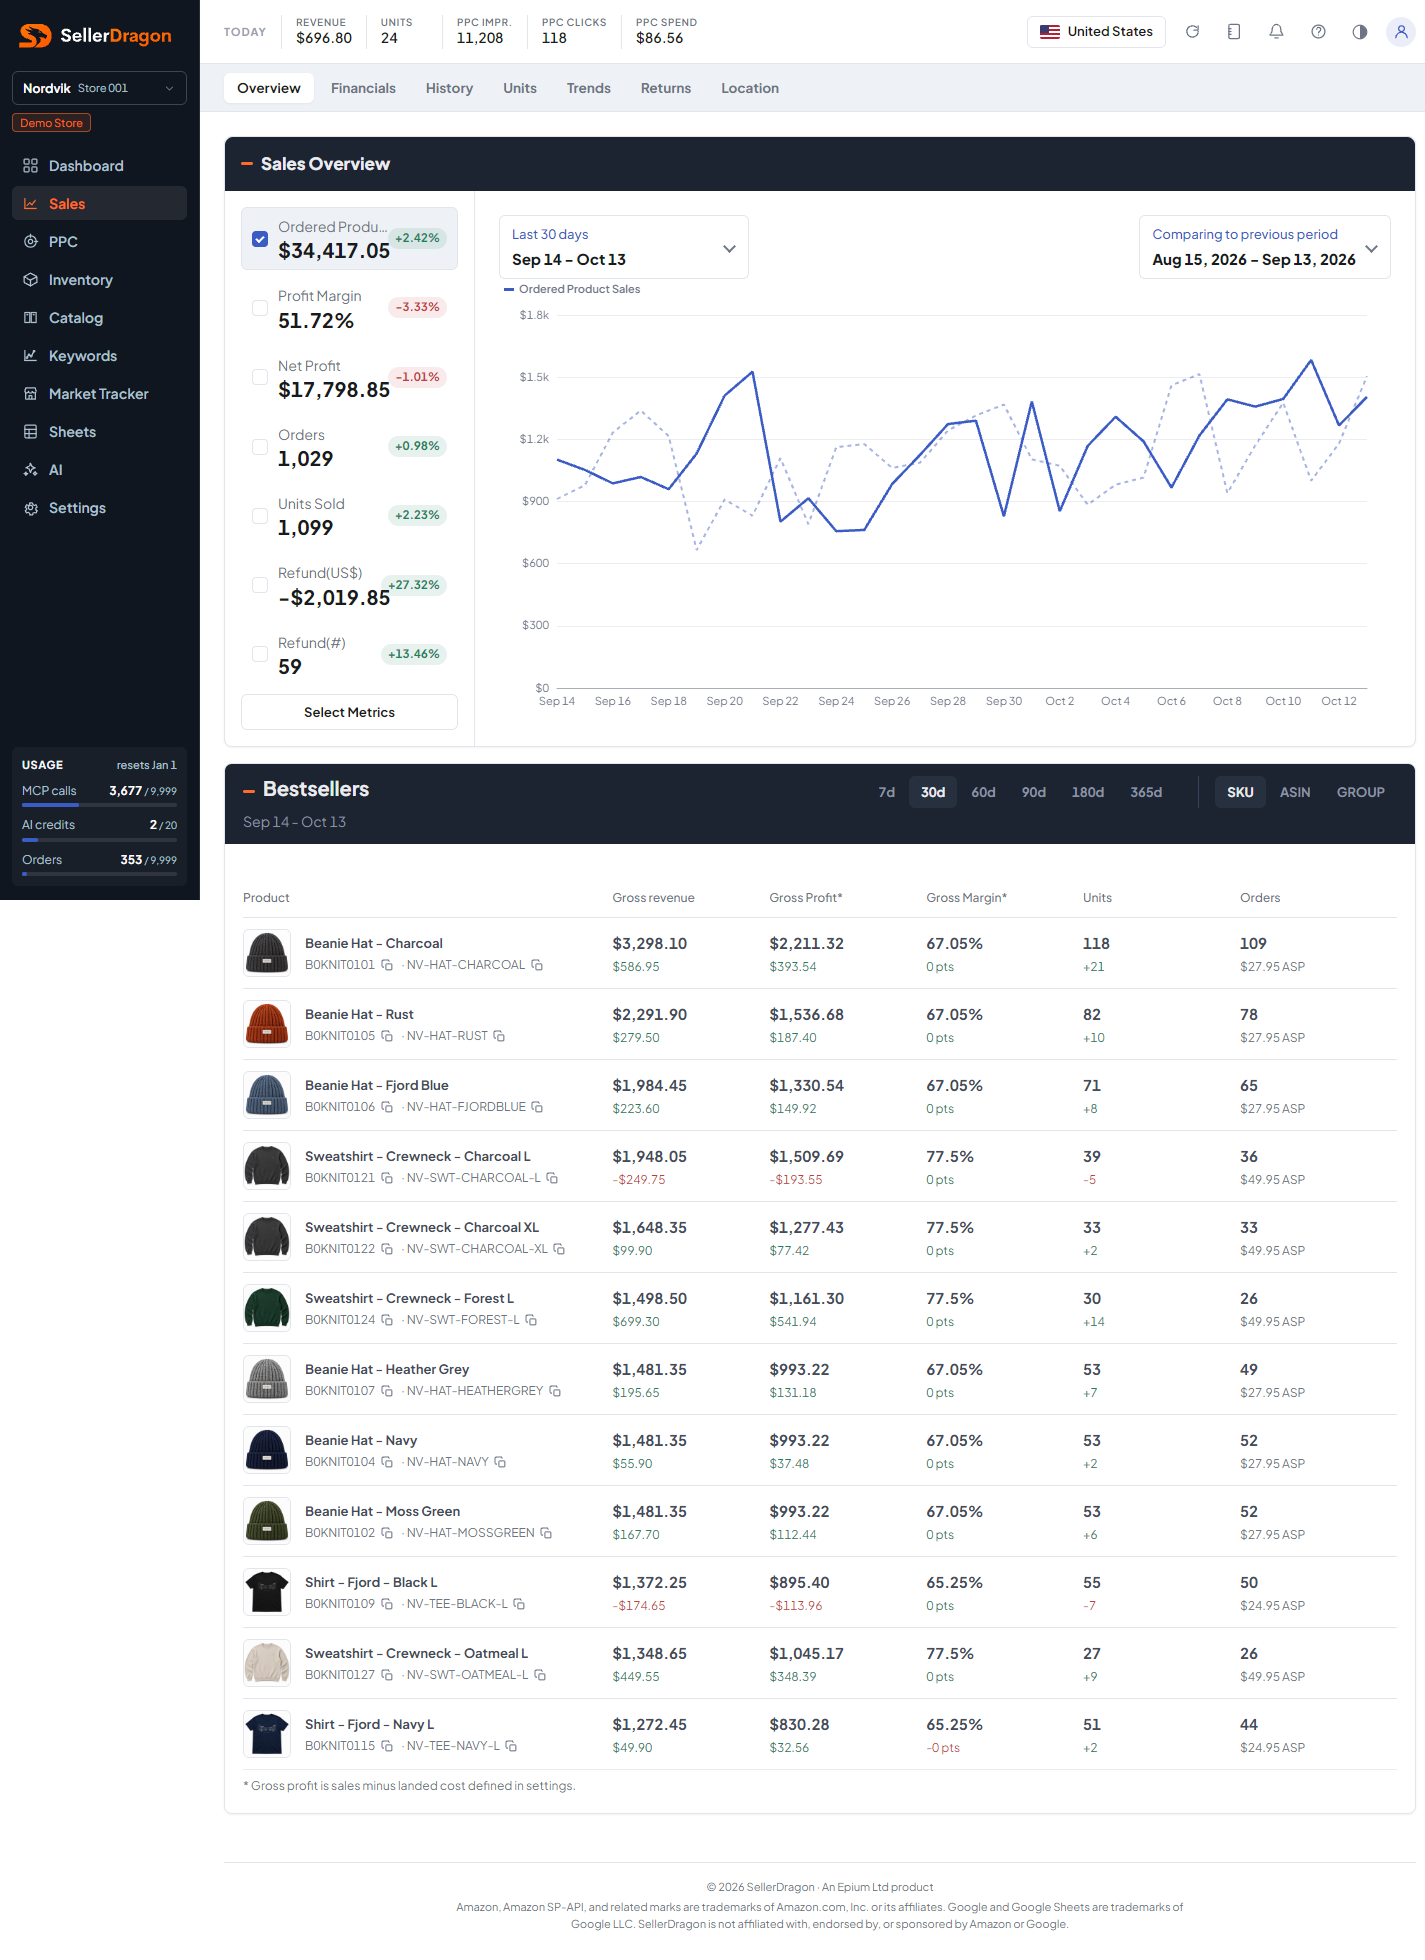
The seven tiles on the left are the period totals. Each tile shows the total for the selected period and, in the coloured badge, the change against the comparison period.
- Ordered Product Sales is the gross sales value of the orders in the period.
- Net Profit is sales minus landed cost minus ad spend, with refunds taken off. Amazon fees are not deducted here. Profit Margin is that profit as a share of sales.
- Orders and Units Sold are counts.
- Refund(US$) is the refunded amount, shown negative. Refund(#) is the number of refunded units.
Tick a tile's checkbox to draw it on the chart. Select Metrics opens the same list as a menu. The chart draws one point per day; the solid line is the selected period and the dotted line is the comparison period laid over the same days.
The period picker offers Today, Yesterday, This Week, Last Week, Last 7, 14, 30, 60 or 90 days, This Month, Last Month, This Quarter, Last Quarter, This Year, Last Year, or a custom range. The comparison picker offers the previous period of the same length, the previous week, month or year, a custom range, or none.
Bestsellers
The table ranks your products by gross revenue in the window picked top right (7 to 365 days, independent of the chart's period). Switch the grain between SKU, ASIN and GROUP (your product groups from Settings, Product Names).
- Gross revenue is sales in the window. The smaller number under it is the change against the previous window of the same length.
- Gross Profit is sales minus landed cost. Ad spend and Amazon fees are not deducted. Gross Margin is that as a share of sales, with the change in percentage points.
- Units with the change in units, and Orders with the average selling price (ASP) under it.
Product names link to the product's listing page. The copy icons copy the ASIN or SKU.
Where to go next
- Sales financials for the full fee and payout picture.
- Sales history for the long-run table by day, week or month.
- Trends for products that are rising or falling.
- Returns for refunds by product and reason.
- SKU Costs & Timing to maintain landed costs.