

What this page answers
How many units of each product to send to Amazon now, and when the next sends are due, so you neither run out nor sit on stock.
Whose data and scope
- One store and one marketplace. FBA stock only (sellable plus incoming); stock you hold for FBM does not count as stock. FBM sales do count as demand.
- Demand is your own sales history, FBA and FBM, by marketplace date. Nothing is stored except your own adjustment and retired flag per product; the forecast is recalculated from the data every time the page loads.
- Lead time per SKU (production, shipping and Amazon check-in) and the default stock target come from Settings, SKU Costs & Timing. When lead time is empty the page assumes 21 days.
- Amazon's days-of-supply figure comes from Amazon's restock report and decides when Amazon will accept a shipment, not how much to send.
How to read it
Top strip
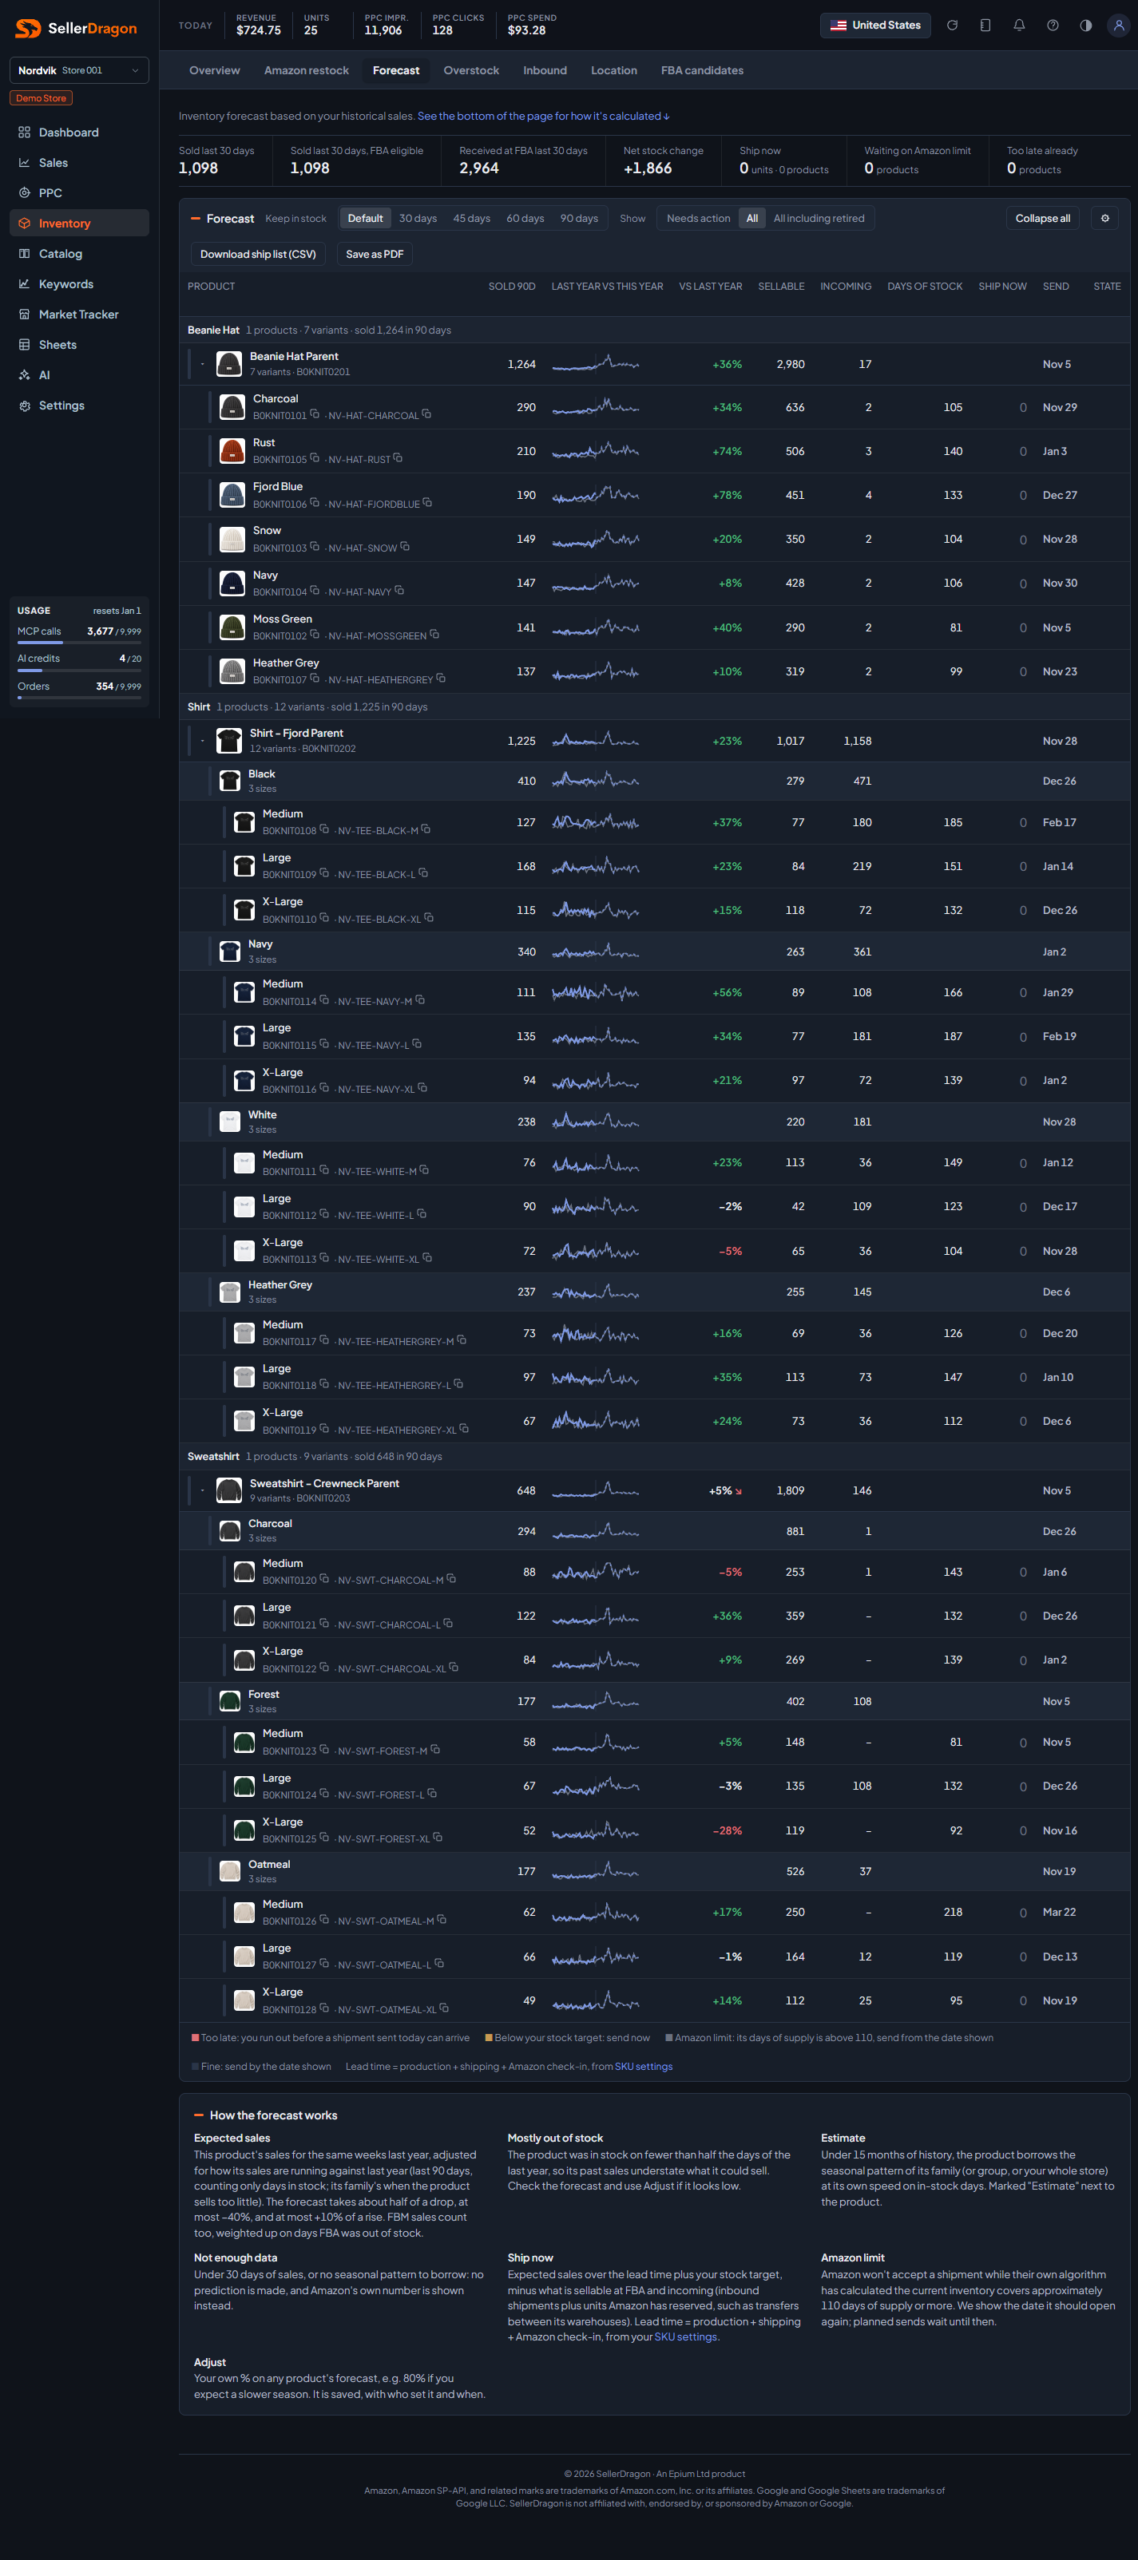
Sold in the last 30 days (every product, then FBA-listed products only), units received at FBA in the last 30 days, the net stock change, and three decision counts: units and products to ship now, products waiting on Amazon's limit, and products that are too late already.
Stock target, show, columns, export
- Keep in stock is the stock target: Default (each SKU's own target from settings, at most 90 days) or 30, 45, 60 or 90 days for everything. The page already holds the plan for every target, so switching is instant.
- Show filters the tree: Needs action (something you can do now), All, or All including retired.
- Expand all opens every family. The gear hides optional columns; the decision columns (Ship now, Send, State) cannot be hidden.
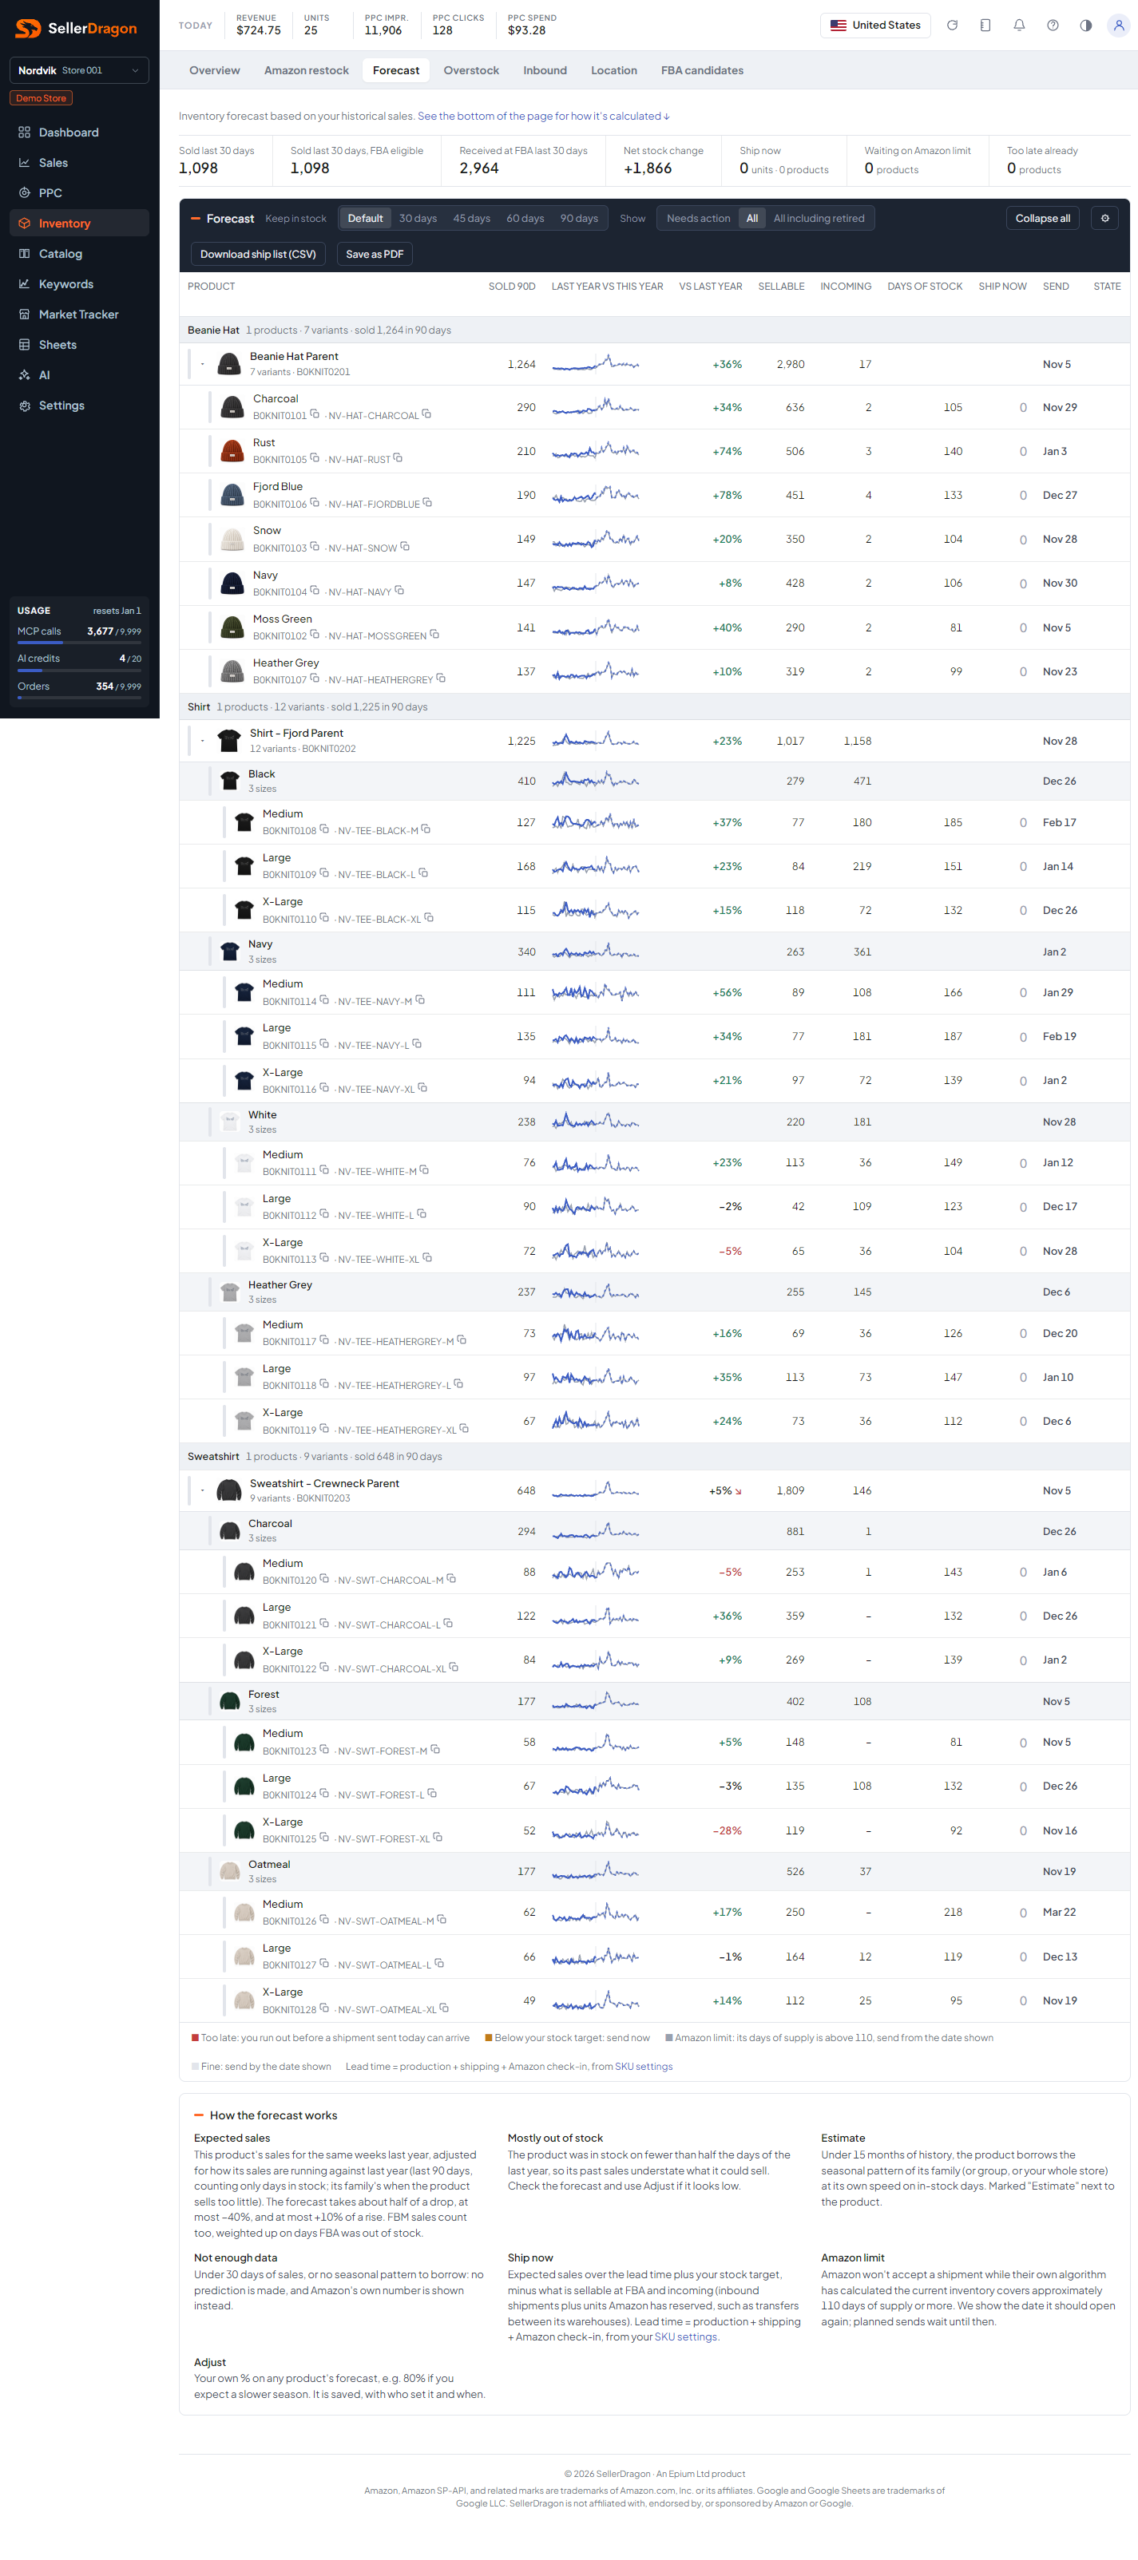
- Download ship list (CSV) exports every product that needs a send now, for building the shipment. Save as PDF prints the table with every family expanded.
Forecast table
Rows are grouped by product group, then parent, then colour, then size, using the listing's variation axes. Parent and colour rows roll up sales, stock and the worst status; ship quantities only appear on individual products.
- Sold 90d is units sold in the last 90 days, FBA plus FBM.
- Last year vs this year is a 52-week sparkline: last year, this year so far, and the forecast ahead.
- vs last year is the product's in-stock sales rate over the last 90 days against the same days last year. The arrow on a parent shows whether the family's last 4 weeks run better or worse than its last 13.
- Sellable and Incoming are FBA stock now and inbound shipments plus units Amazon has reserved in its warehouses.
- Days of stock is how long sellable plus incoming lasts at the forecast rate.
- Ship now is the units to send today: expected sales over the lead time plus the stock target, minus sellable and incoming, times your adjustment.
- Send is Now, or the date of the next send, or the date Amazon's limit opens.
- State is red when you run out before a shipment sent today lands (Late, with the days), amber when below target so send now, grey when Amazon's limit blocks a send, and white when fine.
- Planned sends to FBA shows the quantities to send now and at 30-day steps for the next five months.
- Amazon says is Amazon's own replenishment quantity for comparison.
- Adjust is your percentage on the forecast, saved on blur or Enter.
An "Estimate" tag means the product has under 15 months of history and borrows the seasonal shape of its family, group or store. "Not enough data" means under 30 days of sales or nothing to borrow; Amazon's number is shown instead. "Mostly out of stock" warns that past sales understate demand.
How the forecast works
The block at the bottom of the page repeats the rules in plain words: expected sales are last year's same weeks adjusted by how the product is running against last year (half of a drop, at most −40%; at most +10% of a rise), with FBM sales weighted up on days FBA was out.
Tabs and popups
Product popup
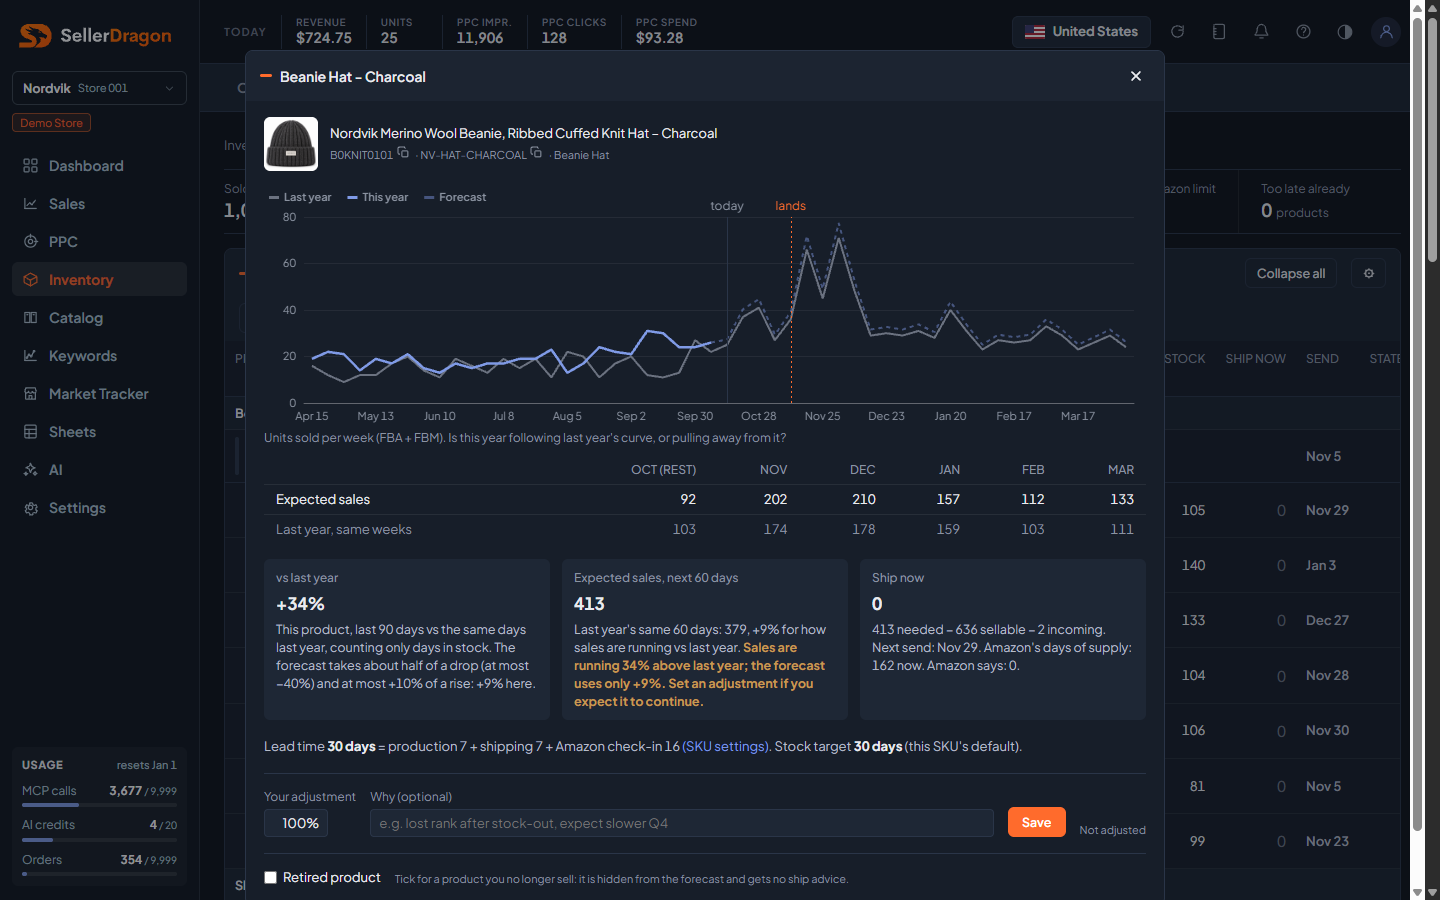
- Chart: units per week, last year, this year and the forecast, with markers for today and for when a shipment sent today would land. The table under it gives expected sales per month next to last year's same weeks.
- vs last year: the swing the forecast uses and how much of it was applied.
- Expected sales, next 60 days with the reasoning in one sentence.
- Ship now: the arithmetic (needed minus sellable minus incoming), the next send date, Amazon's days of supply and Amazon's own number, and the lead time and stock target used.
- Your adjustment: a percentage and an optional reason, saved with who set it and when. Reset to 100% clears it.
- Retired product: tick for a product you no longer sell. It is hidden from the forecast and gets no ship advice; its history still feeds the family pools.
Where to go next
- SKU Costs & Timing to set lead times and stock targets.
- Amazon restock for Amazon's own recommendation.
- Inbound to follow the shipments once sent.