

What this page answers
For the searches that lead to your products, how big is each search, how does the market behave on it, and what share of the impressions, clicks and purchases do you get. This is the data the whole keyword strategy rests on; PPC pages only measure what ads did to it.
Whose data and scope
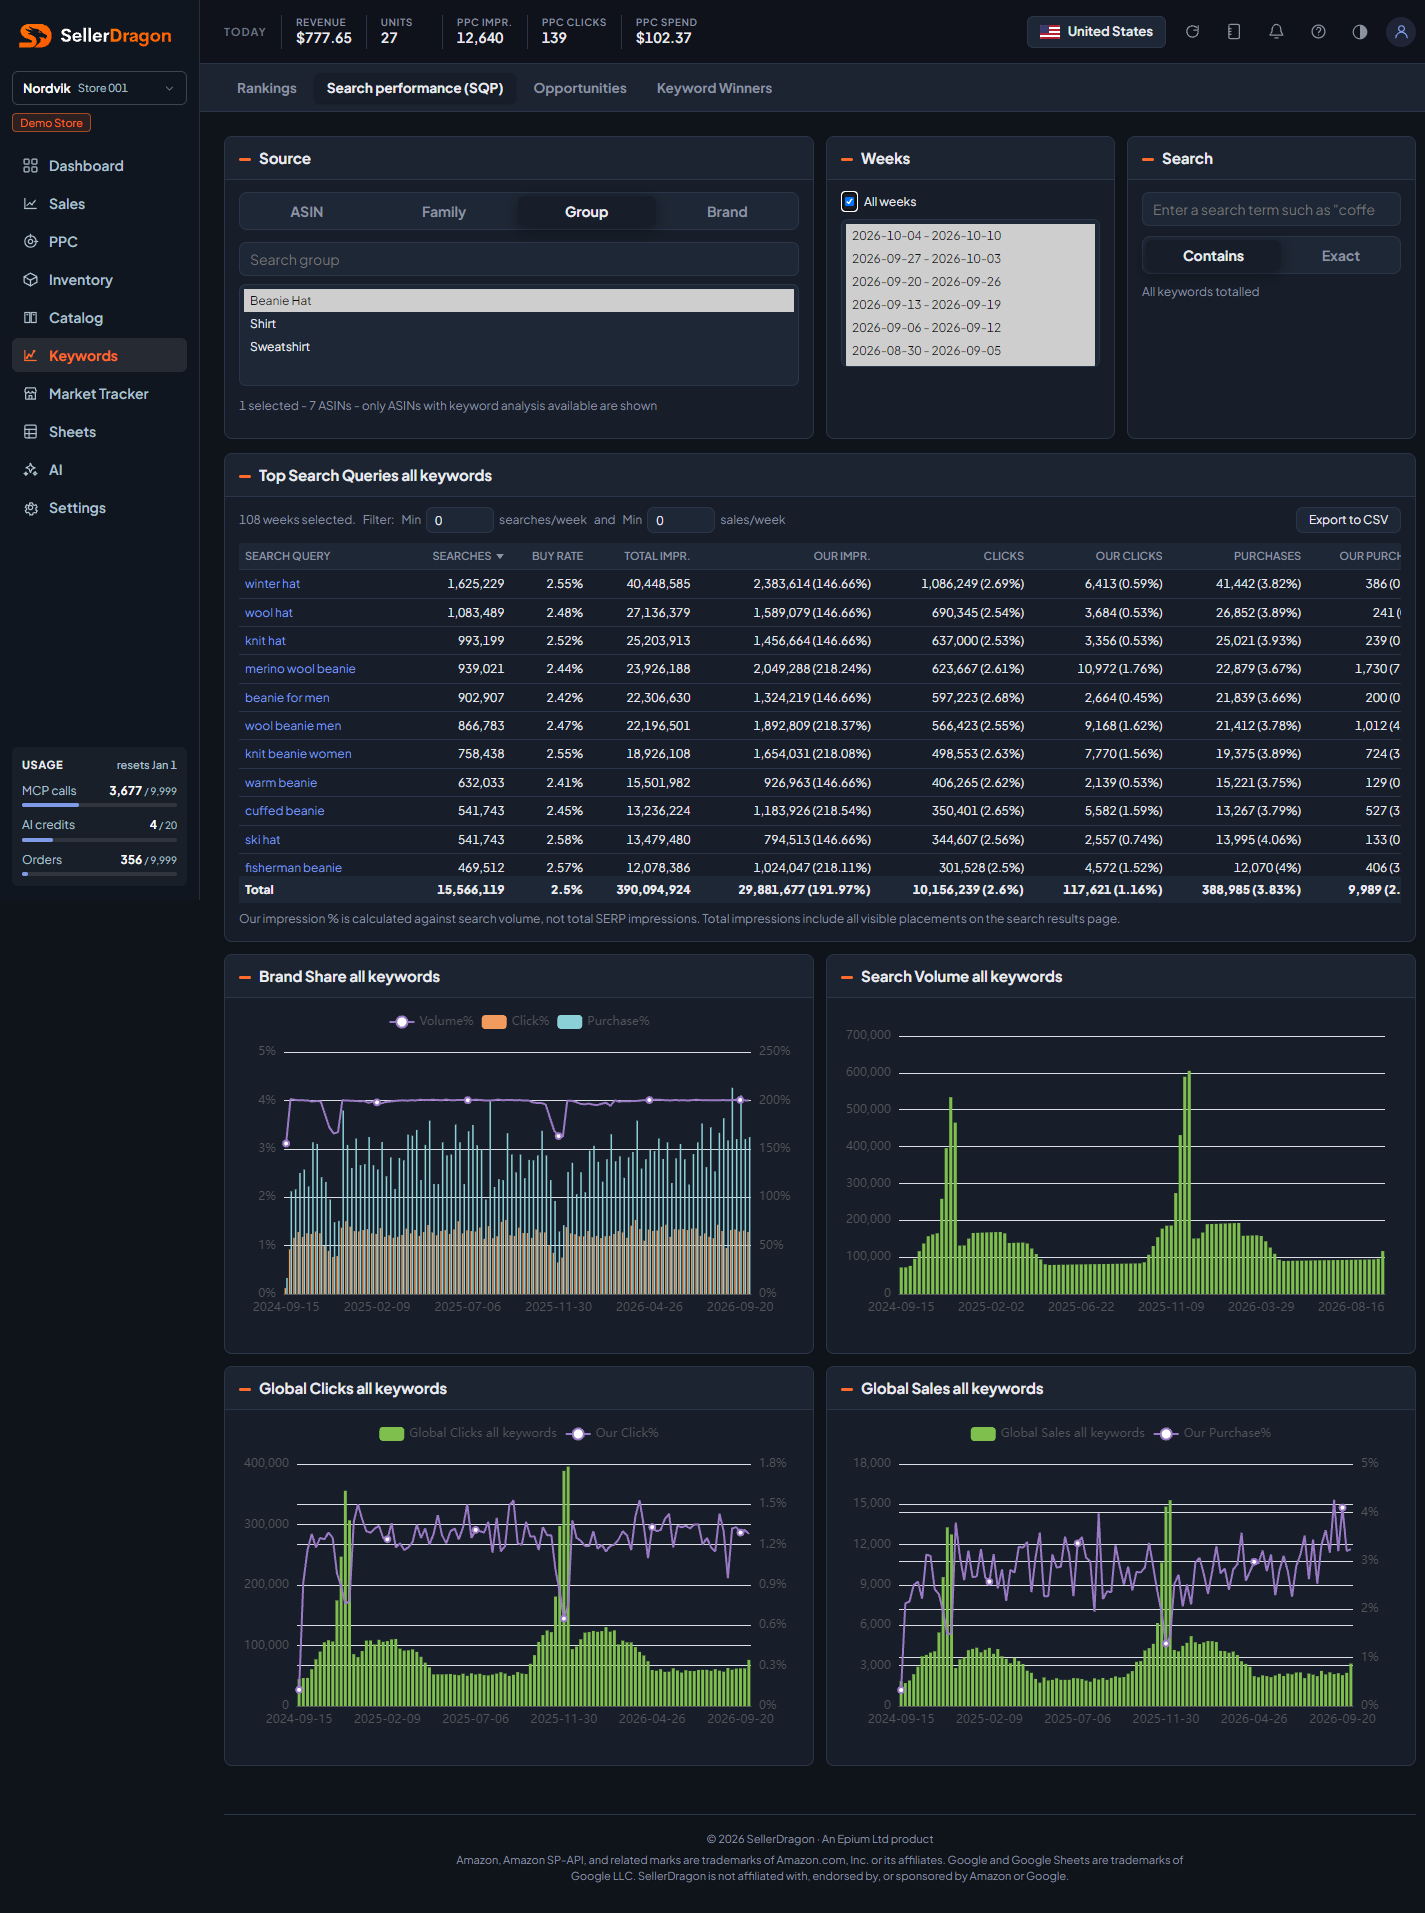
- One store and one marketplace. Source is one or more ASINs, variation families, product groups (your groups from Settings) or brands.
- Data is Amazon's Search Query Performance report from Brand Analytics, which needs Brand Registry. Amazon publishes it per week, often 3 to 5 days late. Without Brand Registry the page explains why it is empty; right after onboarding it says the data is on its way.
- Market numbers (searches, total impressions, clicks, purchases) are for the whole search across all sellers. "Our" numbers are the selected source's share. When the source is a group or family, "our" counts are summed over its ASINs, so a percentage can exceed 100 when several of your products appear on the same search.
- Our impression percentage is calculated against search volume, not total impressions, because total impressions count every placement on the results page.
How to read it
Source picker
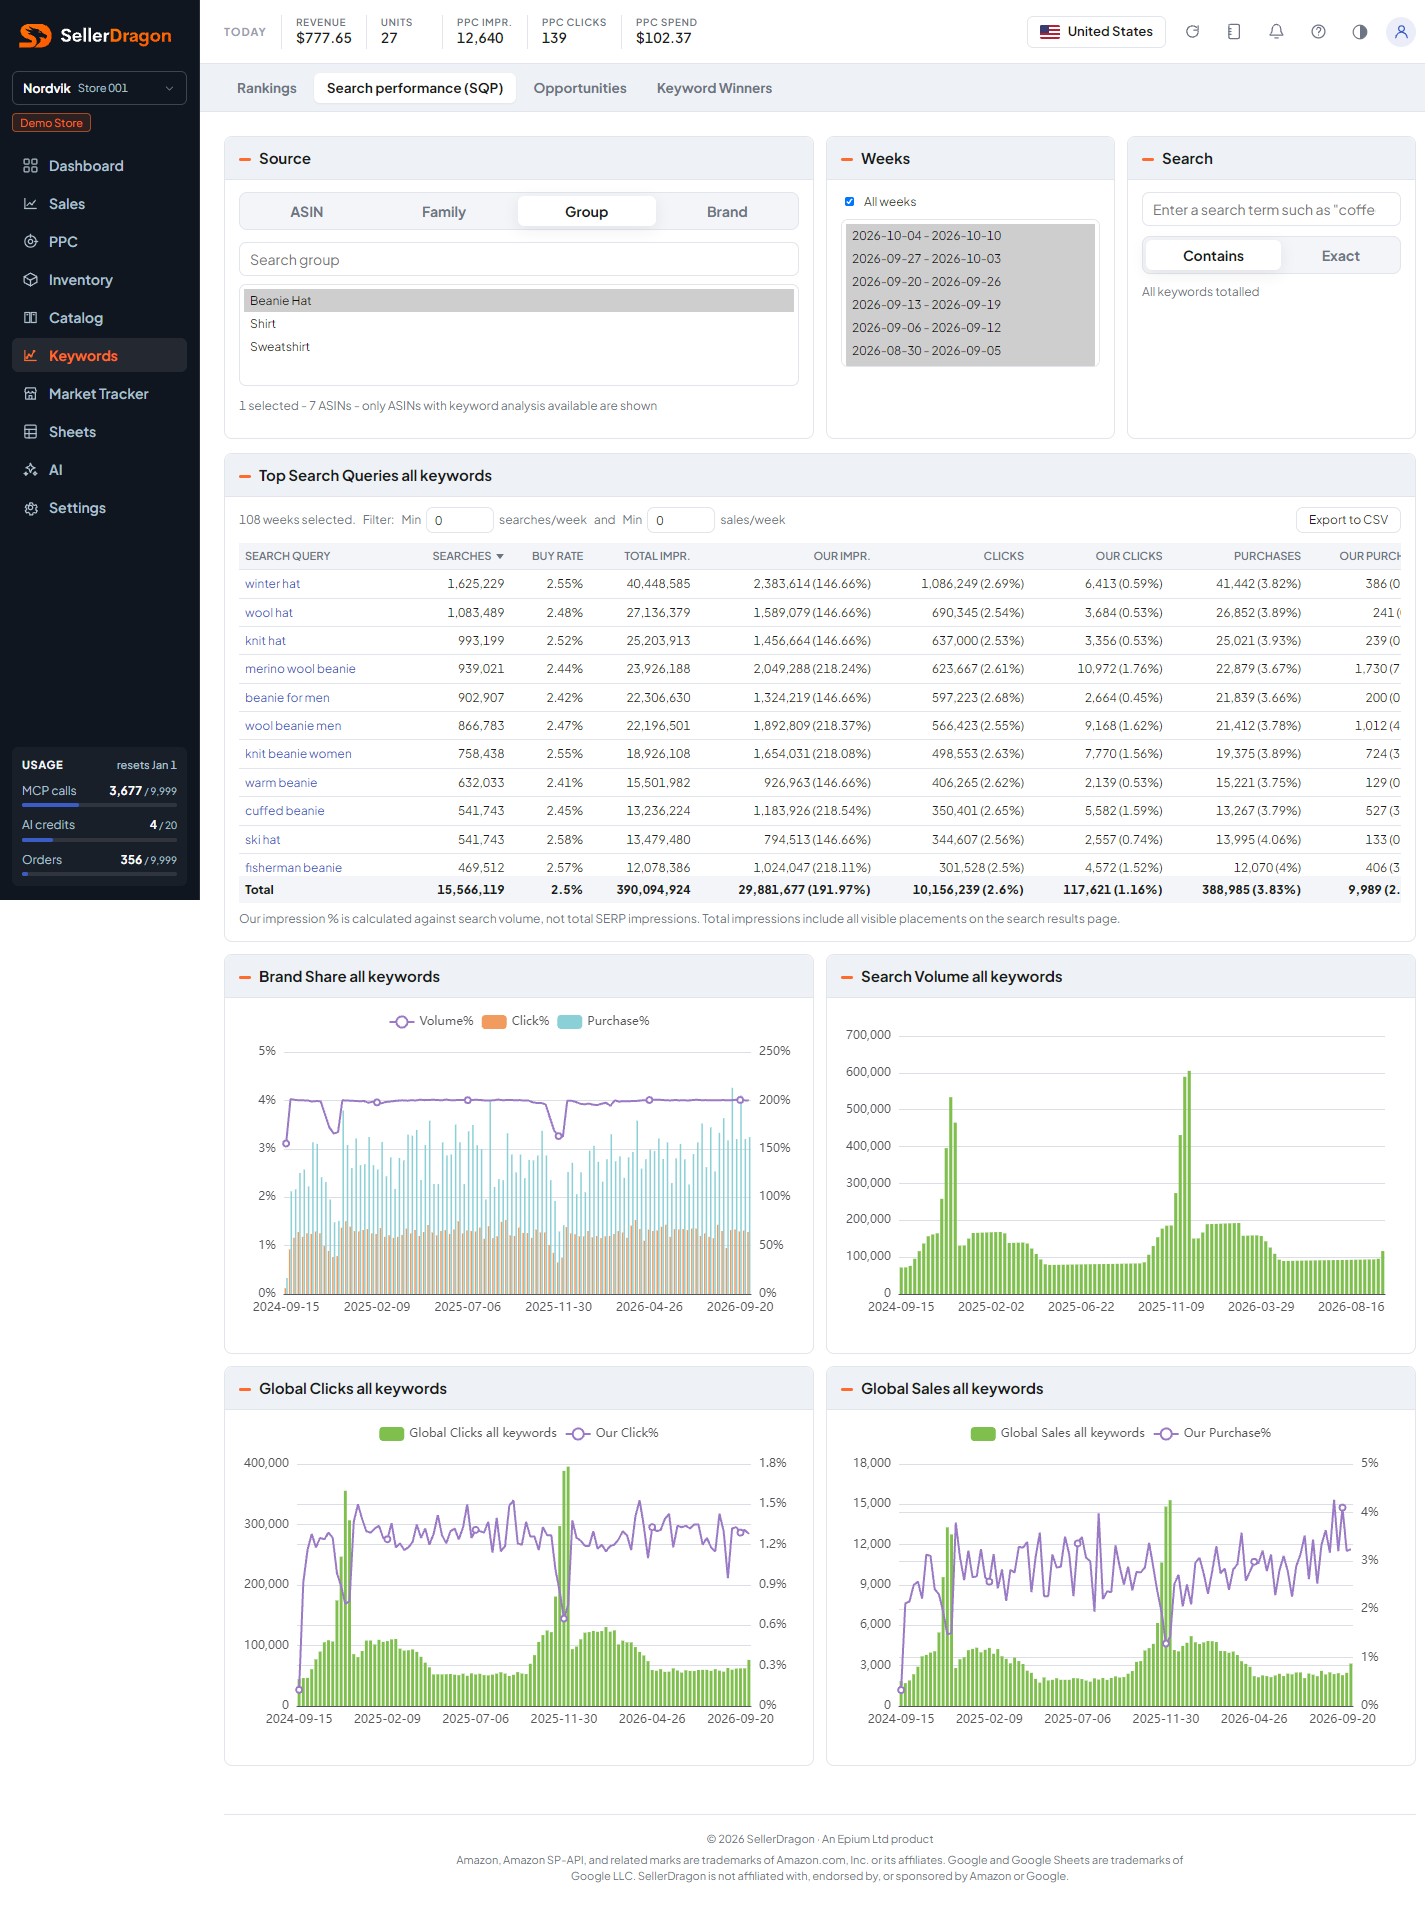
Choose the grain (ASIN, Family, Group, Brand) and then one or more entries. Only entries that have search data are listed.
Weeks picker
Tick All weeks or select individual reporting weeks. The table sums the selected weeks; the charts show one point per week.
Search box
Type a search term to narrow the table and charts. Contains matches any query containing the text; Exact matches one query, which turns the charts into that query's history. The line under the box says what is in view.
Top Search Queries table
One row per search query over the selected weeks, with a minimum searches-per-week and sales-per-week filter and a CSV export.
- Searches is the search volume. Buy Rate is purchases divided by searches for the whole market.
- Total Impr. and Our Impr. with our percentage of search volume.
- Clicks and Our Clicks with our click share. Purchases and Our Purchases with our purchase share.
Charts
- Brand Share: our volume share (line) with our click share and purchase share (bars) per week.
- Search Volume: market searches per week.
- Global Clicks and Global Sales: market clicks and purchases per week, each with our share as a line.
Where to go next
- Opportunities to turn this data into a list of searches worth working on.
- Keyword rankings to track your organic position on these searches.
- Weekly market review for the AI's reading of the same data per family.